
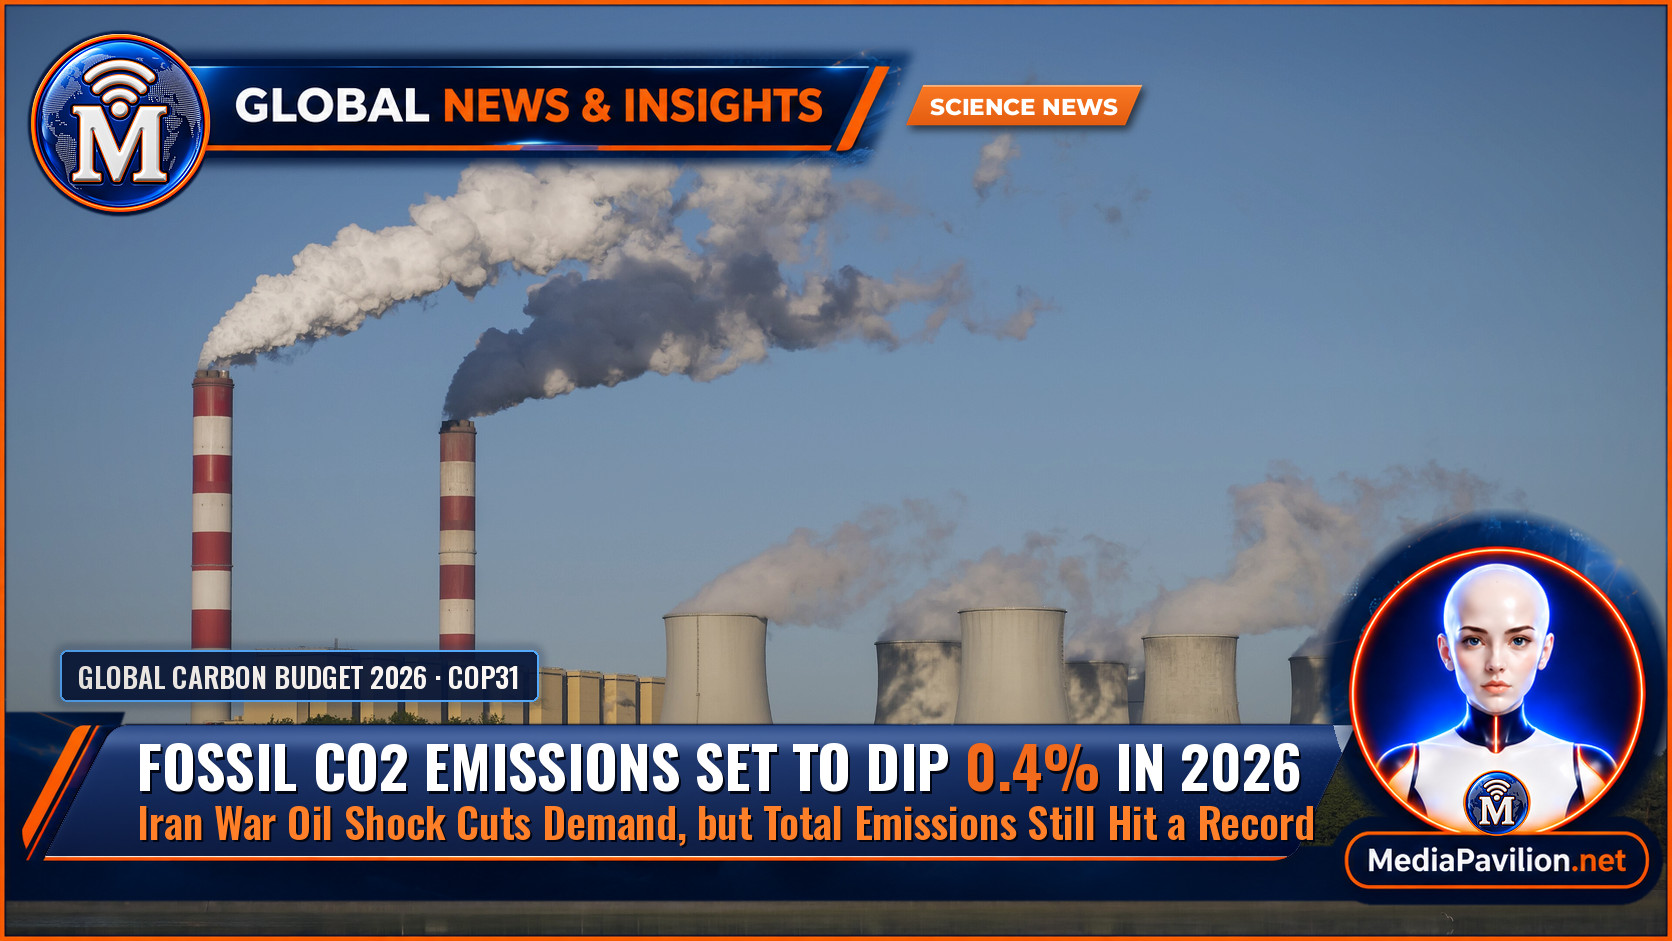
Global Carbon Budget 2026: Fossil Emissions Dip 0.4%
Global carbon dioxide emissions from fossil fuels are projected to fall by about 0.4% in 2026, to 38.2 billion tonnes, according to the Global Carbon Budget 2026 published on Tuesday, 10 November. The scientists behind the annual report say the dip is driven mainly by a 1.9% drop in oil emissions, as the energy shock from the Iran war and the closure of the Strait of Hormuz pushed fuel prices up and demand down.
The authors stress that this is not yet the long-awaited peak. Coal emissions are still rising, the projection’s range includes a small increase, and total emissions, once deforestation and other land-use change are added, are set to hit a record 43.3 billion tonnes. The findings were presented at the COP31 climate summit in Antalya.
What Does the Global Carbon Budget 2026 Show?
The Global Carbon Budget is produced each year by the Global Carbon Project, an international team of scientists, and published in the journal Earth System Science Data. This is its 21st edition. According to Carbon Brief’s analysis of the report, the main figures are:
- Fossil CO2 in 2026: 38.2 billion tonnes (GtCO2), down about 0.4%, with a range from a 1.5% fall to a 0.6% rise
- Oil: down 1.9%, falling in every major region
- Coal: up 0.6%, about 41% of fossil emissions
- Gas: down 0.3%, effectively flat
- Land-use change: up to 5.1 GtCO2 from 4.4 GtCO2 in 2025, driven by peat fires and forest degradation in south-east Asia during a strong El Niño
- Total CO2 (fossil plus land use): a record 43.3 GtCO2, up from 42.8 GtCO2
- Atmospheric CO2: expected to reach 427.7 parts per million, 54% above pre-industrial levels
Why Did Emissions Fall in 2026?
The biggest factor was oil. Carbon Brief said petrol and diesel prices in the US, China and the EU were 10% to 50% higher than in 2025, depending on the fuel and the period. The Guardian reported that drivers economised on fuel and switched to electric vehicles, while the wider expansion of cheap solar and wind power continued.
A companion study by the same team in Nature Climate Change found that growth in solar, wind and electric vehicles now offsets around two-thirds of the emissions that rising energy demand would otherwise add. That is significant progress, but not enough to push emissions into a sustained decline on its own.
Which Countries Cut Emissions and Which Increased?
- United States: down 1.3%, mainly because less coal was burned, The Guardian reported
- European Union: down 1.5%
- China: down 0.9%, helped by a 4.6% fall in oil emissions
- India: up 4.4%, mostly from coal
Per person, the gaps remain large. Carbon Brief noted that 2025 per-capita emissions were about 14.5 tonnes in the US against 2.2 tonnes in India. The global average is around 4.6 tonnes per person in 2026, about 4% below its peak in the early 2010s.
Is This the Peak in Global Emissions?
The authors say it is too early to tell. “A drop in emissions in one year is not a peak, unless it is driven by structural change,” Glen Peters of the Cicero Centre for International Climate Research told The Guardian. He said the growth of solar, wind, batteries and electric vehicles was pushing emissions down in dozens of countries but was “not sufficient to lock in a peak”.
Several things could reverse the dip, including a fall in oil prices if the Iran conflict eases, faster coal growth in India and US policy that favours fossil fuels. The report also expects the current El Niño to weaken the land carbon sink in 2027, after the sink reached a record high in 2025.
What Does It Mean for the 1.5C Limit?
The report estimates that human-caused warming reached 1.37C above pre-industrial levels in 2025. It puts the remaining carbon budget for a 50% chance of limiting warming to 1.5C at 150 billion tonnes of CO2 from the start of 2027, which is less than four years of current emissions. The budgets for 1.7C and 2C are about 510 and 1,035 billion tonnes, or roughly 12 and 24 years.
Over the past decade, total CO2 emissions grew by an average of 0.3% a year, compared with 1.7% a year in the decade before. That slowdown is real, but scientists say emissions now need to fall quickly, not just level off. If you want the background, our explainers on global warming vs climate change and El Niño vs La Niña explain the science behind these numbers.
Related Reading
- COP31 Opens in Antalya: What’s at Stake
- Global Warming vs Climate Change: What’s the Difference?
- Is the Iran War Over? What Trump Said and What Happens Next
- More climate and environment coverage
Featured image: Bełchatów power station in Poland, Europe’s largest coal-fired plant, by Stephan van Helden / Wikimedia Commons, CC BY-SA 4.0. File photo.
Sources
- Earth System Science Data (preprint) — Global Carbon Budget 2026 (10 November 2026).
- Carbon Brief — Analysis: Fossil-fuel CO2 emissions set to dip in 2026 as Iran conflict hits oil use (10 November 2026).
- The Guardian — Slight fall in carbon emissions from fossil fuels as Iran war drives renewables push (10 November 2026).
- ABC News (Australia) — 2026 carbon budget says Iran war sparked decline in fossil fuel emissions (10 November 2026).